Original Link: https://www.anandtech.com/show/458
The release of NVIDIA’s Quadro and GeForce based cards will impact professional users that depend on powerful graphics accelerators for their technical applications. NVIDIA’s Quadro and GeForce GPU (Graphics Processor Unit) are capable of 50 billion floating point operations per second (50GFLOPS) which is considerably higher than most mainstream professional cards with on-board transforming and lighting engines that boast performance of around 5 billion floating point operations per second. The Quadro DDR is the top of NVIDIA food chain; it is their top gun and most expensive NVIDIA based card.
NVIDIA's Quadro GPU ( NV10GL) is set apart from the consumer grade GeForce (aside from it’s price tag) by enabling certain features on the Quadro that were left disabled on the GeForce since the latter was not intended to be a high end solution. Among these features is enhanced support for anti-aliased points and lines, which although isn’t a commonly used feature with most users, was an extremely poor performance point for the GeForce. While these settings might conceptually be “enabled” on the GeForce through driver tweaks/registry hacks, it is unclear exactly what methods NVIDIA went to in order to make sure that they were disabled on the GeForce, to this date no one has discovered the magic hack.
On paper, NVIDIA’s Quadro very closely resembles the GeForce, with a few exceptions. The core clock of the Quadro is 135MHz, a 15MHz increase from the 120MHz core clock of the GeForce. The higher core clock allows the Quadro to achieve a 13% higher fill rate of 540 Mpixels/s. The Quadro also features a peak triangle rate of 17 million triangles per second up from the GeForce’s 10 – 15 million triangles per second. The Quadro designs ( SDR and DDR ) typically are configured with 64 MB of memory to further differentiate the Quadro cards from the consumer grade GeForce cards which has 32 MB of memory.
The initial releases of the GeForce and Quadro card designs used 128 bit SDR ( single data rate - 1 bit of data per tick per memory line ) SDRAM memory system running at 166 MHz providing 2.656 GB/s of memory bandwidth. The memory bandwidth provided by this design was not adequate when the cards were used in certain render intensive applications. NVIDIA's solution was to provide support for DDR ( double data rate - 2 bits of data per tick per memory line ) SDRAM running at 150 MHz, this provides 4.8 GB/s of memory bandwidth (an increase of 80.7%).
The addition of the DDR configuration to the Quadro design mix further enhances NVIDIA's ability to compete with the established players, 3Dlabs, Intergraph, and E&S, in the professional graphics card market. When this reference Quadro DDR design reaches the marketplace soon it will likely be in the form of a ELSA GLoria II DDR graphics card, since ELSA has been selected by NVIDIA to be exclusive vendor for Quadro based professional graphics cards.
The cost for the DDR version of the Quadro will be more than for the SDR version, which costs about $650. US, and given the current cost differential between the SDR and DDR versions of the GeForce ( ~ $90. US ) and allowing for twice the memory, a realistic cost projection for the Quadro DDR would be about $830. US. Is the added cost for the DDR version worth the projected cost difference?
Another problem NVIDIA has is timing: the production version of the Quadro DDR card is not yet on the market; at the same time, the consumer cards using the next generation NV15 GPU's are due to arrive on the scene this spring. The window of opportunity for cards using the NV10GL chips ( the Quadro DDR and SDR ) is not very large.
The applications
The technical applications and their associated needs are what drives this professional market segment. Typical applications are Mechanical Computer Aided Design (MCAD) tools such as PTC’s Pro/E, Solidworks, and SDRC Ideas and visualization/simulation applications such as Maya and 3D Studio MAX. Unlike the consumer game market where the goal is entertainment, these systems must be a productive and cost effective part of an organization’s work process.
The goal of the MCAD process is basically expressed as “art to part”. In an essentially paperless setting, engineers conceptualize, design, and analyze a product and all its component parts based on the data contained in the MCAD program’s database and, at the end of this iterative process, the database is used to generate the Computer Aided Manufacturing (CAM) data to drive the fabrication process. Traditional paper 2D drawings (blueprints) are neither used nor needed. This type of work process reduces the time to market for new products. For a more detailed look at the MCAD requirements the reader is referred to the ELSA GLoria II review. The prevailing view is that this class of applications needs cards that have very high polygon rates
Visualization / simulation applications such as Maya and 3D Studio MAX have a different set of, but no less stringent, requirements than those for MCAD applications. While MCAD application needs high precision data ( 64 bit floating point ) in the underlying data store, these applications need a precise screen display since the real end product from this work is a visual and not a machined piece of metal.
The competitors
NVIDIA’s competitors in the technical workstation graphics card market segment include 3Dlabs, Evens & Sutherland, Diamond, and Intergraph. Some of the key characteristics of NVIDIA's Quadro based cards and the competitors’ products sold on the open market are summarized in the following table:
|
Quick Comparison Chart |
||||
|
Card |
Estimated Street Price (USD) | Driver with Profiles for Professional Applications | Transforming & Lighting | Memory Sub System |
| NVIDIA Quadro DDR |
Unknown |
Not Yet |
On-chip 50 GFLOPS | 64MB - 128 bit DDR |
|
ELSA GLoria II - NVIDIA Quadro SDR |
$650.00 |
Yes |
On-chip 50 GFLOPS |
64MB - 128 bit SDR |
|
3DLabs VX1 |
$200.00 |
Yes |
Host CPU |
32 MB - 128 bit SDR |
|
3DLabs GVX1 |
$680.00 |
Yes |
On Card - 3 GFLOPS |
32 MB - 128 bit SDR |
|
3DLabs GVX210 |
Unknown |
Yes |
On Card - 5 GFLOPS |
64 MB - 256 bit SDR |
|
E&S Lighting 1200 |
$400.00 |
Yes |
Host CPU |
15 MB 3DRAM, 16 MB CDRAM |
|
E&S Tornado 3000 |
$1,250.00 |
Yes |
Host CPU |
30 MB 3DRAM, 16 MB CDRAM |
|
Diamond Fire GL1 |
$770.00 |
Yes |
Host CPU |
32MB - 256 bit SDR |
Note: The 3Dlabs GVX210 was announced an shown in August, 1999 but is not yet in production.
In addition to these products other high end products are available as part of complete workstation systems:
1) Intergraph Wildcat cards in Intergraph, Dell, Compaq and IBM workstations.
2) HP’s fx+ series of graphics processors available in their workstations.
3) SGI’s line of NT workstations with SGI’s own integrated graphics processor (Cobalt).
4) NEC’s new line of high end NT workstation with their hot new TE4E graphics systems on sale in Japan at only about $15K-$25K US.
Price – The sweet spot in this market seem to be in the $500-$1000 range; 18 months ago it was $2000-$3000.
Drivers - Cards sold into this market need to have OpenGL driver tuning profiles set up for the mainstream technical applications.
Transform & Lighting – Dedicated transform and lighting hardware can provide real performance benefits when running large models.
Memory system - A graphics card’s memory design is one good indicator of its fill rate performance potential.
The Quadro GPU designs does appear to have a key technical advantage over the competition; it has an on chip 50 Gflop transform and lighting engine. Of the other cards only the 3Dlabs (GVX1 and GVX210) and expensive Wildcat 4110 cards have this specialized hardware support. However, note that these cards use a separate processor chip for this function and that the processing rate is approximately 10 to 16 times slower.
The Card
The reference NVIDIA Quadro DDR is an AGP graphics card whose main components are a NVIDIA Quadro chip, hidden under the fan/heatsink, and (8) 64 Mbit Hyundai DDR SDRAM memory chips. The Quadro DDR reference card unlike the GLoria II Quadro SDR doesn't adhere to the NLX form factor specification for a peripheral card. The layout closely resembles that of ELSA’s ERAZOR X2 DDR SDRAM GeForce 256 product.
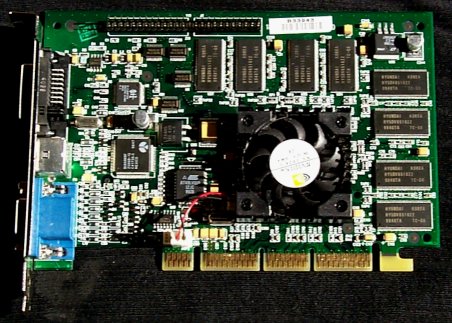
The card has 64 Mbytes of Double Data Rate (DDR) SDRAM on the card, which is twice the amount on the current production GeForce 256 cards. The memory bus architecture ( 128 bit ) appears to be the same as that on the GeForce 256 DDR cards. The RAMDAC is a 350 MHz unit and resolutions to 2048x1536 at 85 Hz at truecolor are supported. The card supports normal analog video, LCD digital and S-video outputs.
Drivers
The ELSA NT 4.0 GLoria II Quadro SDR driver used for the GLoria II review would not work with this card so the NVIDIA 3.65 driver was used for testing. This driver lacked specific profiles for the professional applications. It is expected that the production form of this card will include a professional class driver.
The Test
|
Windows NT SP6a Test System |
|
|
Hardware |
|
|
CPU |
|
|
Motherboard |
Intel SE440BX2 |
|
Memory |
3 x 128MB PC100 SDRAM - 384 MB Total |
|
Hard Drive / Controller |
2 x Quantum Atlas III 9 GB – Wide Ultra2 SCSI / Adaptec AHA-2940U2W |
|
CDROM |
HP 8100 CD/RW |
|
Video Card(s) |
NVIDIA Quadro DDR 64 MB (default clock - 135/150) ELSA
GLoria II Quadro SDR 64 MB (default clock - 135/166) |
|
Ethernet |
Intel 100Mbit PCI Ethernet Adapter |
|
Software |
|
|
Operating System |
Windows NT 4 SP6a |
|
Video Drivers |
GLoria
II Quadro SDR- ELSA Driver 4.02.02.014_19 B |
|
Benchmarking Applications |
|
|
Technical |
Indy3D
ver. 3 |
The tests were performed at 1280x1024 truecolor with Vsync off.
Note that four categories of technical benchmark codes from simple to complex were used in this review:
1) SPEC’s GLperf 3.1.2 and Intergraph's 3D ExerciZer - Are simple OpenGL test tools useful for looking at the performance of specific OpenGL operations.
2) Indy3D Ver. 3 - Somewhat more complex code that tries to simulate real apps.
3) SPEC’s ViewPerf 6.1.1 - Test code that uses fragments of real apps with simulated data sets.
4) SPEC APC Pro/E 20 and OCUS R20 – Tests that require the actual application, Pro/E Ver. 20, to be run with test data.
SPEC’s GLperf
SPEC’s Glperf 3.1.2 is a good, low level, easy to use OpenGL test tool that one can use to look at how graphics card/systems handle specific OpenGL functions. This tool was used to investigate the tri-meshed strip performance of the cards under review. Tri-meshed strips are one of the most efficient ways of presenting geometric data to be processed in that it reduces the compute load for either the GPU or host CPU depending on the card’s design. GLperf is driven by a script and the execute fragment for the one used for initial test was:
TriangleStripTest {
(UserString printf("(%s,flat)",
ExecuteMode))
(ExecuteMode Immediate)
(DepthTest GL_LEQUAL)
(ObjsPerBeginEnd 4)
(Size from 1 to 512 step 100%)
(ShadeModel GL_FLAT)}
This test script generates and plots flat shaded triangle strips with the triangle areas stepping from 1 pixel to 512 pixels. The test output was put into chart form:
This chart shows triangle performance (triangles per sec.) as a function of pixels per triangle. The two main constraints on card performance is evident in the plot’s shape. A card’s peak geometry T&L rate defines a horizontal line and the card’s peak fill rate locates the diagonal line representing constant maximum fill rate. On the flat horizontal portion of the curve the card is triangle rate limited and on the sloped portion of the curve it is fill rate limited.
The Quadro DDR has the best performance. The GLoria II (Quadro SDR ) and the CL Annihilator (GeForce SDR ) have almost exactly the same performance on this test and appear as a single line on the plot. The AGP version of the GVX1 is better than the PCI version. Since the VX1 and the TNT2Ultra use the host CPU for T&L, their peak triangle rates were about the same. The value of an on card GPU is clearly seen in this chart: the GVX1, GeForce and Quadro are clearly faster on peak triangle rate than the other cards that depend on the host CPU.
The maximum fill rate for the Quadro DDR was about 65% better than for the Quadro SDR or GeForce SDR, this fact clearly shows the benefit of the reference card's DDR SDRAM.
As one moves from simple flat shading to more complex shading and textures, the performance drops. A test was performed on the Quadro DDR and the GLoria II (Quadro SDR) with tri-linear textures and one infinite light. The GLperf script fragment was:
TriangleStripTest {
(UserString printf("Triangle Strip (%s, 64x64 RGB trilinear modulated texture, smooth, 1 inf light)", ExecuteMode, Size))
(ExecuteMode Immediate )
(DepthTest GL_LEQUAL)
(ObjsPerBeginEnd 4)
(Size from 1 to 512 step 100%)
(NormalData PerVertex)
(TexTarget GL_TEXTURE_2D)
(TexWidth 64)
(TexHeight 64)
(TexComps 3)
(TexLOD 3)
(TexMagFilter GL_LINEAR)
(TexMinFilter GL_LINEAR_MIPMAP_LINEAR)
(TexFunc GL_MODULATE)
(NormalData PerVertex)
(TexData PerVertex)
(ShadeModel GL_SMOOTH)
(InfiniteLights 1)}
The results are compared to the flat shaded performance in the following chart:
Reviewers have noticed problems with anti-aliased (AA) wireframe performance for the GeForce equipped cards; the Quadro GPU should not have this problem. GLperf was used to investigate the AA line performance of the cards used in this review. The chart below shows the results for 32 pixel flat shaded AA lines and illustrates the GeForce/driver issue:
In this test, the Quadro
DDR performed very well and was about as fast as the (GVX1
– AGP).
Intergraph 3D ExerciZer
Intergraph's 3D ExerciZer is a good, low level, easy to use OpenGL test tool that one can use to look at how graphics cards handle specific operations under varying load conditions. This tool was used to investigate the texture handling performance of the Quadro DDR in comparison to the other cards.
The test output was put into chart form:
This chart shows the cards' measured performance (frames per sec.) as a function of texture size. The Quadro cards ( DDR and SDR ) with 64 MB or memory clearly perform better once the texture size is in the range of about 16 MB - 48 MB. This is one area where the Quadro cards with 64 MB of memory have an advantage over the 32 MB GeForce cards.
Indy3D Version 3
The Indy3D graphics evaluation tool was constructed by Sense8 to aid end-users in evaluating OpenGL 3D performance issues using application-focused metrics (MCAD, animation and simulation markets), image quality stress tests and 3D primitive metrics. The four application sub tests were used in the review measure the cards performance. The tests were performed with the standard Indy3D default settings. The screen resolution was 1280 x1024 truecolor with Vsync off.
First, a word about the driver profiles used for these tests. For the ELSA and 3Dlabs drivers, the four tests (MCAD40, MCAD150, Animation, Simulation) were run with the Pro/E profile. In addition, the Animation and Simulation tests were run again using the Lightscape profile. The best scores were logged. The NVIDIA 3.65 driver did not have any such tuning options.
The scores are in fps with the best scores shown in bold.
|
Indy3D – Ver 3 |
MCAD40 |
MCAD150 |
MCAD150
WF/Poly |
Animation |
Simulation |
|
Ref. Quadro DDR – NVIDIA 3.65 |
43.97 | 14.79 | 5.78/19.29 | 38.23 | 82.3 |
|
ELSA GLoria II SDR Quadro – ELSA Driver |
36.32 |
13.74 |
5.30/17.96 |
41.68 |
48.12 |
|
ELSA GLoria II SDR Quadro – NVIDIA 3.65 |
36.93 |
13.88 |
5.77/17.93 |
38.17 |
50.84 |
|
CL Annihilator SDR GeForce –NVIDIA 3.65 |
30.33 |
11.31 |
1.56/16.19 |
38.17 |
49.92 |
|
3Dlabs Oxygen GVX1, AGP |
19.06 |
5.71 |
3.52/6.80 |
20.79 |
29.33 |
|
3Dlabs Oxygen GVX1 – PCI |
17.17 |
5.02 |
2.46/6.30 |
19.29 |
25.98 |
|
3Dlabs Oxygen VX1 |
11.54 |
3.68 |
1.40/4.82 |
14.22 |
22.56 |
|
Diamond Viper 770 Ultra TNT2 – NVIDIA 3.65 |
11.57 |
3.65 |
1.94/4.51 |
11.94 |
35.89 |
When looking at these scores remember that this test suite consists of simulated app code, and the models aren’t very large or complex. It was designed to be an easy to run, get the numbers quick, test tool. Shown in the results table is a breakout of the wireframe (WF) and polygon (Poly) performance in the MCAD150 sub test.
The Quadro DDR clearly beat all the others for this suite of tests. The Quadro's have a huge advantage over the GeForce in wireframe drawing speed. In the other areas, the Quadro DDR was much faster than the Quadro SDR on the Simulation test.
SPEC’s ViewPerf - ProDesigner Viewset (ProCDRS-02)
The SPEC organization viewset, ProCDRS-02, is a replacement for the much used CDRS viewset. It is intended to model the graphics performance of PTC's Pro/Designer software. Unlike the CDRS, the ProCDRS-02 data set is large (a trunk); for the shaded model 281,000 vertices and 131,000 triangles and for the wireframe 202,000 vertices and 184,000 lines.
There are 10 tests in this test suite; the first 2 tests are AA wireframe and the other 8 are shaded/rendered tests.
Tests 1 & 2 - AA
Wireframe
Tests 3 & 4 - Shaded
Tests 5 & 6 - Shaded with texture
Tests 7 & 8 - Shaded with texture & dynamic reflections
Tests 9 & 10 - Shaded with color per vertex
The tests were ran at 1280x1024 truecolor with Vsync off. The Pro/E profile was selected for the ELSA driver and the 3Dlabs drivers; the NVIDIA 3.65 driver did not have any such tuning options.
|
ProCDRS-02 Weight: |
25% |
25% |
10% |
10% |
5% |
5% |
3% |
3% |
7% |
7% |
|
Composite |
Shaded
|
|
Test # |
1 |
2 |
3 |
4 |
5 |
6 |
7 |
8 |
9 |
10 |
|
Score |
3+4 |
|
|
fps |
fps |
fps |
fps |
fps |
fps |
fps |
fps |
fps |
fps |
|
|
|
|
Ref. Quadro DDR – NVIDIA 3.65 |
29.2 | 35.3 | 17.5 | 20.5 | 15.1 | 17.6 | 16.7 | 18.7 | 13.9 | 16.4 | 23.44 | 38.0 | |
|
GLoria II SDR Quadro – ELSA Driver |
29.8 |
33.2 |
22.7 |
24.7 |
18.2 |
20.0 |
17.7 |
18.3 |
16.4 |
18.8 |
|
25.19 |
47.4 |
|
GLoria II SDR Quadro– NVIDIA 3.65 |
25.8 |
29.9 |
16.2 |
18.3 |
13.8 |
15.6 |
15.5 |
16.4 |
12.8 |
14.8 |
|
20.76 |
34.5 |
|
CL Annihilator 256 SDR - GeForce |
Crash |
Crash |
16.1 |
18.2 |
14.1 |
15.7 |
14.6 |
15.2 |
13.1 |
14.9 |
|
-- |
34.3 |
|
3Dlabs GVX1 - AGP |
20.1 |
16.6 |
15.8 |
15.8 |
12.8 |
12.7 |
12.9 |
13.5 |
10.2 |
12.3 |
|
15.68 |
31.6 |
|
3Dlabs GVX1 - PCI |
16.5 |
14.2 |
11.4 |
12.7 |
8.25 |
9.60 |
8.27 |
10.2 |
10.1 |
11.7 |
|
12.77 |
24.1 |
|
3Dlabs VX1 |
7.31 |
7.78 |
7.08 |
8.26 |
5.72 |
6.75 |
4.56 |
5.95 |
4.18 |
5.57 |
|
6.815 |
15.34 |
|
Diamond Viper 770 Ultra - TNT2 |
10.4 |
14.3 |
15.2 |
17.2 |
14.3 |
15.8 |
13.3 |
15.5 |
12.9 |
14.9 |
|
13.55 |
32.4 |
SPEC’s ViewPerf - DesignReview Viewset (DRV-06)
A description from SPEC’s site:
“DesignReview is a 3D computer model review package specifically tailored for plant design models consisting of piping, equipment and structural elements such as I-beams, HVAC ducting, and electrical raceways. It allows flexible viewing and manipulation of the model for helping the design team visually track progress, identify interference, locate components, and facilitate project approvals by presenting clear presentations that technical and non-technical audiences can understand.
“The DRV-06 model in this viewset is a subset of the 3D plant model made for the GYDA offshore oil production platform located in the North Sea. DesignReview works from a memory-resident representation of the model that is composed of high-order objects such as pipes, elbows valves, and I-beams. During a plant walkthrough, each view is rendered by transforming these high-order objects to triangle strips or line strips. Tolerancing of each object is done dynamically and only triangles that are front facing are generated. This is apparent in the viewset model as it is rotated. Most DesignReview models are greater than 50 megabytes and are stored as high-order objects. For this reason and for the benefit of dynamic tolerancing and face culling, display lists are not used. “
The test data set is shown below:
There are 6 tests specified by the SPEC DRV-06 viewset that represent the most common operations performed by DesignReview. These tests are as follows:
|
Test |
Weight |
DRV functionality represented |
|
1 |
45% |
Walkthrough rendering of curved surfaces. Each curved object (i.e., pipe, elbow) is rendered as a triangle mesh, depth-buffered, smooth-shaded, with one light and a different color per primitive. |
|
2 |
30% |
Walkthrough rendering of flat surfaces. This is treated as a different test than #1 because normals are sent per facet and a flat shade model is used. |
|
3 |
8% |
For more realism, objects in the model can be textured. This test textures the curved model with linear blending and mipmaps. |
|
4 |
5% |
Texturing applied to the flat model. |
|
5 |
4% |
As an additional way to help visual identification and location of objects, the model may have "screen door" transparency applied. This requires the addition of polygon stippling to test #2 above. |
|
6 |
4% |
To easily spot rendered objects within a complex model, the objects to be identified are rendered as solid and the rest of the view is rendered as a wireframe (line strips). The line strips are depth-buffered, flat-shaded and unlit. Colors are sent per primitive. |
|
7 |
4% |
Two other views are present on the screen to help the user select a model orientation. These views display the position and orientation of the viewer. A wireframe, orthographic projection of the model is used. Depth buffering is not used, so multithreading cannot be used; this preserves draw order. |
The tests were performed at 1280x1024 truecolor Vsync off. The Pro/E profile was selected for the ELSA driver and the 3Dlabs drivers; the NVIDIA 3.65 driver did not have any such tuning options. The scores were:
|
DRV-06 Weight: |
45% |
30% |
8% |
5% |
4% |
4% |
4% |
|
Composite |
|
Test # |
1 |
2 |
3 |
4 |
5 |
6 |
7 |
|
Score |
|
|
fps |
fps |
fps |
fps |
fps |
fps |
fps |
|
|
| Ref. Quadro DDR – NVIDIA 3.65 | 24.5 | 34.4 | 18.4 | 21.3 | 34.3 | 12.8 | 14.1 | 25.43 | |
|
ELSA GLoria II SDR Quadro – ELSA Driver |
23.6 |
33.4 |
17.5 |
20.4 |
33.6 |
13.8 |
13.8 |
|
24.67 |
|
ELSA GLoria II SDR Quadro – NVIDIA 3.65 |
24.7 |
31.6 |
17.9 |
19.9 |
30.8 |
12.7 |
13.9 |
|
24.62 |
|
CL Annihilator 256 SDR - GeForce |
24.4 |
30.9 |
17.9 |
19.7 |
29.8 |
12.7 |
13.9 |
|
24.27 |
|
3Dlabs GVX1 - AGP |
15.4 |
17.9 |
13.2 |
13.4 |
18.4 |
9.35 |
10.5 |
|
15.36 |
|
3Dlabs GVX1 - PCI |
13.2 |
16.0 |
10.1 |
11.7 |
16.7 |
7.87 |
9.20 |
|
13.26 |
|
3Dlabs VX1 |
7.80 |
7.65 |
6.66 |
6.72 |
7.86 |
4.75 |
5.08 |
|
7.327 |
|
Diamond Viper 770 Ultra - TNT2 |
10.1 |
11.8 |
8.42 |
9.13 |
9.36 |
3.38 |
3.41 |
|
9.481 |
The Quadro DDR, GLoria II (Quadro SDR) and GeForce SDR equipped cards scored about the same and were about 60% faster than the next best card, the GVX1-AGP.
Test data posted at the SPEC site shows that only two of the high end workstation systems (that use 700/733 MHz Intel Coppermines with the Intergraph Wildcat 4110 and NEC TE4E graphic systems) score about the same as the Quadro DDR. On this test the GeForce SDR is very close to the Quadro SDR or DDR in performance, this is another example of where the Quadro cards do not offer a large enough performance improvement over the GeForce SDR to justify their added cost.
SPEC’s ViewPerf - Data Explorer (DX-05)
A description from SPEC’s site:
“The IBM Visualization Data Explorer (DX) is a general-purpose software package for scientific data visualization and analysis. It employs a data-flow driven client-server execution model and is currently available on Unix workstations from Silicon Graphics, IBM, Sun, Hewlett-Packard and Digital Equipment. The OpenGL port of Data Explorer was completed with the recent release of DX 2.1.
“The tests visualize a set of particle traces through a vector flow field. The width of each tube represents the magnitude of the velocity vector at that location. Data such as this might result from simulations of fluid flow through a constriction. The object represented contains about 1,000 triangle meshes containing approximately 100 vertices each. This is a medium-sized data set for DX.”
The tests assume z-buffering with one light in addition to specification of a color at every vertex. Triangle meshes are the primary primitives for this viewset. While Data Explorer allows for many other modes of interaction, these assumptions cover the majority of user interactions.
There are 10 sub test in this viewset:
|
Test |
Weight |
DX functionality represented |
|
1 |
40% |
TMESH's immediate mode. |
|
2 |
20% |
LINE's immediate mode. |
|
3 |
10% |
TMESH's display listed. |
|
4 |
8% |
POINT's immediate mode. |
|
5 |
5% |
LINE's display listed. |
|
6 |
5% |
TMESH's list with facet normals. |
|
7 |
5% |
TMESH's with polygon stippling. |
|
8 |
2.5% |
TMESH's with two sided lighting. |
|
9 |
2.5% |
TMESH's clipped. |
|
10 |
2% |
POINT's direct rendering display listed. |
All tests were performed at 1280x1024 truecolor with Vsync off. The Lightscape profile was selected for the ELSA driver and the 3Dlabs drivers; the NVIDIA 3.65 driver did not have any such tuning options. The test results were:
The Quadro DDR, GLoria II (Quadro SDR) and GeForce SDR equipped cards scored about the same and were about 20% faster than the next best card, the GVX1-AGP. The GVX1-PCI, VX1 and TNT2Ultra cards performed about the same on this test. Test data posted at the SPEC site shows that two of the higher end workstation systems, which use the Intergraph Wildcat 4110 and NEC TE4E graphic systems, score about 100% better than the Quadro DDR, GLoria II (Quadro SDR) or GeForce SDR.
SPEC’s ViewPerf - Advanced Visualizer (AWadvs- 03)
SPEC's AWadvs-03 viewset represents the most common operations performed by Advanced Visualizer. Advanced Visualizer from Alias/Wavefront is an integrated workstation-based 3D animation system that offers a comprehensive set of tools for 3D modeling, animation, rendering, image composition, and video output.
All operations within Advanced Visualizer are performed in immediate mode with double buffered windows. The test data set is illustrated below:
These are the 10 tests specified by SPEC's AWadvs-03 viewset:
|
Test |
Weight |
Advanced Visualizer functionality represented |
|
1 |
41.8% |
Material shading of polygonal animation model with highest interactive image fidelity and perspective projection. |
|
2 |
28.5% |
Wireframe rendering of polygonal animation model with perspective projection. |
|
3 |
10.45% |
Material shading of polygonal animation model with lowest interactive image fidelity and perspective projection. |
|
4 |
9.5% |
Smooth shading of polygonal animation model with perspective projection. |
|
5 |
4.75% |
Flat shading of polygonal animation model with perspective projection. |
|
6 |
2.2% |
Material shading of polygonal animation model with highest interactive image fidelity and orthogonal projection. |
|
7 |
1.5% |
Wireframe rendering of polygonal animation model with orthogonal projection. |
|
8 |
.55% |
Material shading of polygonal animation model with lowest interactive image fidelity and orthogonal projection. |
|
9 |
.5% |
Smooth shading of polygonal animation model with orthogonal projection. |
|
10 |
.25% |
Flat shading of polygonal animation model with orthogonal projection. |
All tests were performed at both 1280x1024 truecolor, with Vsync off. The Lightscape profile was selected for the ELSA driver and the 3Dlabs drivers; the NVIDIA 3.65 driver did not have any such tuning options. The test results were:
The Quadro DDR, GLoria II (Quadro SDR) and GeForce SDR equipped cards performed quite well on this benchmark suite; the Quadro DDR was about 10% faster than the next fastest, the Quadro SDR. The Quadro DDR was better than any of the system AWadvs-03 scores recently published at SPEC except those of high cost NEC TE4E system (which scored 93.4 composite). This was one of the few tests that show any benefit for the DDR memory, with a performance gain of about 10% over the SDR Quadro. The GeForce SDR was about 16% slower than the Quadro DDR.
SPEC’s ViewPerf - Lightscape-03
The Lightscape Visualization System from Discreet Logic combines proprietary radiosity algorithms with a physically based lighting interface. A sample screen shot is shown:
There are four tests specified by the viewset that represent the most common operations performed by the Lightscape Visualization System:
|
Test |
Weight |
Functionality represented |
|
1 |
25% |
Walkthrough wireframe rendering of "Cornell Box" model using line loops with colors supplied per vertex. |
|
2 |
25% |
Full-screen walkthrough solid rendering of "Cornell Box" model using smooth-shaded z-buffered quads with colors supplied per vertex. |
|
3 |
25% |
Walkthrough wireframe rendering of 750K-quad Parliament Building model using line loops with colors supplied per vertex. |
|
4 |
25% |
Full-screen walkthrough solid rendering of 750K-quad Parliament Building model using smooth-shaded z-buffered quads with colors supplied per vertex. |
The SPEC Lightscape-03 viewset tests were performed at 1280x1024, truecolor, Vsync off. The Lightscape profile was selected for the ELSA driver and the 3Dlabs drivers; the NVIDIA 3.65 driver did not have any such tuning options
|
Lightscape - 03 Weight: |
25% |
25% |
25% |
25% |
|
Composite |
|
Test # |
1 |
2 |
3 |
4 |
|
Score |
|
|
fps |
fps |
fps |
fps |
|
|
| Ref. Quadro DDR – NVIDIA 3.65 Driver | 4.65 | 5.16 | 2.61 | 2.92 | 3.677 | |
|
ELSA GLoria II SDR Quadro– ELSA Driver |
4.37 |
4.97 |
2.49 |
2.80 |
|
3.508 |
|
ELSA GLoria II SDR Quadro– NVIDIA 3.65 Driver |
4.49 |
4.90 |
2.52 |
2.80 |
|
3.530 |
|
CL Annihilator SDR GeForce |
4.64 |
5.03 |
2.64 |
2.85 |
|
3.640 |
|
3Dlabs Oxygen GVX1 - AGP |
3.11 |
3.58 |
1.99 |
2.18 |
|
2.636 |
|
3Dlabs Oxygen GVX1 - PCI |
2.32 |
2.78 |
1.56 |
1.73 |
|
2.043 |
|
3Dlabs Oxygen VX1 |
2.02 |
2.51 |
1.21 |
1.56 |
|
1.759 |
|
Diamond Viper 770 Ultra TNT2 |
1.53 |
2.95 |
0.981 |
1.68 |
|
1.651 |
The Quadro DDR, GLoria II (Quadro SDR) and GeForce SDR equipped cards scored about the same and were about 38% faster than the next best card the GVX1-AGP. The GVX1-PCI was a lot slower than the AGP version of the same card. The VX1 and TNT2Ultra cards performed the slowest on this test. Test data posted at the SPEC site shows that only the higher end NT workstation systems, which use the Intergraph Wildcat 4110 and NEC TE4E graphic systems, score better (~40%) than the Quadro DDR, GLoria II (Quadro SDR ) or GeForce SDR cards.
OCUS R20 Pro/E Test
The OCUS R20 benchmark, developed by Olaf Corten and available at his site, is a good small-medium size Pro/E benchmark and typically runs in about 8 -12 minutes for these cards. The test consists of 17 sub tests that run via a Pro/E trail file; OCUS roughly categorizes the tests into CPU, Graphics, GUI and I/O components as shown below. Note that this suite tests not only the graphics component but also the CPU and I/O systems.
The test conditions were at 1280x1024 truecolor, Vsync off. The Pro/E profile was selected for the ELSA driver and the 3Dlabs drivers; the NVIDIA 3.65 driver did not have any such tuning options. The test scores are shown below (with the best scores shown in bold):
CPU -
Graphics -
GUI, I/O and Totals -
The Quadro DDR was the fastest on the graphics portion of the test; but all the other cards with on card T&L (GLoria II – Quadro SDR, GeForce SDR, GVX1’s ) were close to the Quadro DDR in score (~ 7%). The two cards without on card T&L, VX1 and TNT2U, performed much worse (~45%). On card T&L does make a lot of difference for some apps.
On the GUI component part of the test, all the tested cards, except for the TNT2U, were within a few seconds of each other. The TNT2U was about 14% slower than the best score.
SPEC’s APC Pro/E Ver. 20
The Pro/Engineer Ver. 20 MCAD benchmark from the SPEC APC organization is a very large Pro/E test, the NT download is about 45MB in zipped form and it expands to about 240 MB of files. The run times range from one to several hours. A description from SPEC’s web page:
“SPEC/GPC's Application Performance Characterization (SPECapcSM) project group offers performance results and free downloads for a benchmark based on Pro/ENGINEER™ Rev. 20. The model used in the benchmark is a realistic rendering of a complete photocopy machine consisting of approximately 370,000 triangles.
“The benchmark comprises 17 tests. Startup and initialization time is measured, but given no weight (0.0) within the composite score for the benchmark. There are 16 graphics tests, each of which measures a different rendering mode or features. The first three graphics tests measure wireframe performance using the entire model. The next four measure different aspects of shaded performance, using the same model. Each of these tests executes exactly the same sequence of 3D transformations to provide a direct comparison of different rendering modes. The next four tests use a subassembly, and compare the two FASTHLR modes, the default shading mode, and shaded with edges. These tests also execute a common sequence of 3D transformations. The last five graphics tests use two different instances of the model - the first three without its outer skins (to illustrate the effect of FASTHLR and level-of-detail operations), and the last two to illustrate complex lighting modes and surface curvature display. The last test is an aggregate of all time not accounted for by the previous 16 tests, and is a mix of CPU and graphics operations.
“Scores are generated for all 17 tests. Composite numbers are provided for each set of graphics tests (shaded, sub-assembly, wireframe and other) and there is an overall composite score for graphics and CPU operations. Start-up and initiation time is not included in the composite score. “
Check out the SPEC/APC site for a more complete benchmark description and sample output from a benchmark run.
The Pro/E profile was selected for the ELSA driver and the 3Dlabs drivers; the NVIDIA 3.65 driver did not have any such tuning options. Listed below are the run time results in seconds (the best times are shown in bold) obtained from this test suite:
Tests 0 through 9 -
Tests 10 through 17 -
The CL Annihilator (GeForce SDR ) with the NVIDIA 3.65 driver failed to complete the test sequence; it appeared to hang in test # 2 (Wireframe-Smooth).
Looking at these raw numbers, two things are apparent:
1) The Quadro DDR and the ELSA GLoria II (Quadro SDR ) were the fastest cards for most of the tested operations.
2) ELSA and NVIDIA need to fix the problem with their drivers that is evident when one looks at the times for test #6 (Shaded–clipped).
To generate the composite scores which SPEC used, a dual Pentium II 300MHz system with 512 MB of memory and an Accel ECLIPSE graphics card was used as a reference system. The composite test scores are computed ratios with respect to this system. The composite scores obtained from the tests were:
|
Test System |
Ref. Quadro DDR |
ELSA GLoria II SDR |
ELSA Gloria II SDR |
3Dlabs GVX1 AGP |
3Dlabs GVX1 PCI |
3Dlabs VX1 |
Diamond 770 Ultra - TNT2 |
|
Driver: |
3.65 |
ELSA |
3.65 |
2.14-1060 |
2.14-1060 |
2.15-0146b |
3.65 |
|
|
|
|
|
|
|
|
|
|
Overall Composite Score |
4.02 |
3.77 |
3.98 |
3.41 |
3.19 |
1.79 |
1.70 |
|
-- Wireframe composite |
5.34 |
5.18 |
5.27 |
4.65 |
3.82 |
2.37 |
2.49 |
|
-- Shaded composite |
3.13 |
2.48 |
3.13 |
3.55 |
3.52 |
1.50 |
1.40 |
|
-- Sub Assy composite |
4.09 |
4.16 |
4.07 |
3.62 |
3.41 |
1.87 |
1.73 |
|
-- Other Composite |
4.71 |
4.66 |
4.69 |
3.59 |
3.38 |
1.68 |
1.63 |
Even with the problems with test # 6, the Quadro DDR had the best overall composite scores slightly better than for the GLoria II Quadro SDR with the 3.65 driver. When the problem with clipping is fixed, the Quadro DDR like the SDR should score in the mid 4’s on the overall composite, which would be about 30% better than those for the 3Dlabs GVX1. The effect of the DDR memory did not appear to be significant factor for this test.
How do the Quadro based cards compare with the somewhat higher cost (more than 8K$) engineering workstations from HP, with the fx6+ graphics, and those that use the new Intergraph Wildcat 4110 graphics engine? Using some of the more basic test scores combined with data from the SPEC site we get the following:
|
Test System |
Ref. Quadro DDR |
ELSA GLoria II SDR Quadro |
ELSA GLoria II SDR Quadro |
IBM Intell. M Pro 733 Wildcat 4110 |
HP P-Class 700, fx6+ |
|
Driver: |
3.65 |
ELSA |
3.65 |
|
|
|
|
|
|
From |
From |
|
|
Test # |
(sec) |
(sec) |
(sec) |
(sec) |
(sec) |
|
2. Wireframe -smooth |
106 |
109 |
107 |
82 |
85 |
|
5. Shaded |
255 |
253 |
256 |
224 |
179 |
Notice that this comparison is not exactly one to one, in that the workstations had faster Coppermine CPU’s. Even so, the Quadro's compare quite well with these more expensive systems.
CPU Utilization
The use of either an on chip (Quadro DDR) or on card (GVX1) T&L processing should off load the host CPU to considerable extent. The CPU workload was measured during the running of the ProCDRS-02 test for the Quadro DDR ( 3.65 driver) and for the 3Dlabs GVX1 – AGP. A chart of the results:
ProCDRS-02 is comprised of 10 sub-tests and the CPU load profiles for each of the cards clearly shows that fact. The Quadro DDR like the Quadro SDR and GeForce cards uses almost all the CPU when running this test and no CPU offloading was observed. On the other hand, the GVX1 uses almost no CPU (less than 10%) during the actual running of each sub-test but does use some at the start of each of the sub-tests when the display list is being created.
The Quadro DDR finishes the test quicker than the GVX1 but at the expense of using all the CPU. This result means that the Quadro DDR’s performance should scale as CPU speed and the GVX1’s performance should be somewhat independent of CPU speed for this type of test.
Image Quality
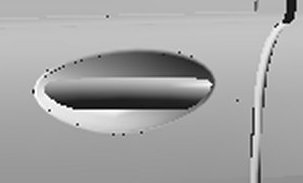
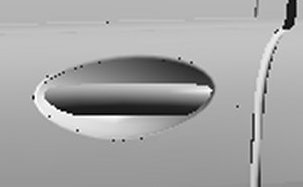
Some readers and 3Dlabs have raised the issue of the image quality of the NVIDIA NV10 chips. ViewPerf ProCDRS-02 does screen captures during each of the 10 sub tests; one of these is a full screen and the other is just a small portion that is used for quality checking. The screen captures are stored in a lossless *.pgn format. The full screen captures for sub test #4 (smooth shaded) were reviewed using Paint Shop Pro Ver. 6 for flaws.
In all cases excepting the TNT2U, the full image captures had many slight mostly one pixel flaws! In general the GVX1 and VX1 had somewhat fewer flaws than the Quadro DDR, the ELSA GLoria II Quadro SDR and the GeForce SDR. The TNT2U image had several multiple pixel flaws and was clearly the worst performer on this test.
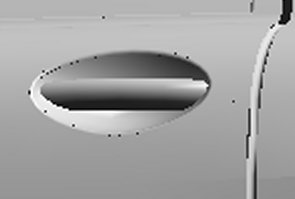
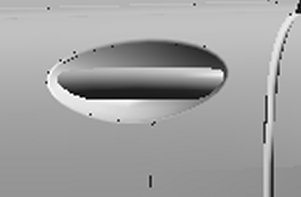
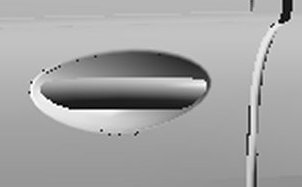
On all the images lots of pixel flaws were observed around the truck's door handle as shown in the table below:
|
Quadro DDR - 3.65 Driver |
ELSA GLoria II - ELSA Driver |
 |
 |
|
GeForce 256 SDR - 3.65 Driver |
TNT2U - 3.65 Driver |
 |
 |
|
3Dlabs GVX1 |
3Dlabs VX1 |
 |
 |
Notice that the observed flaws are the same for the Quadro and GeForce cards even though different drivers were used. The two 3Dlabs cards give similar results even though one uses an on card GPU and the other used the Pentium III SSE instructions to do the T&L.
What causes these problems? A reasonable guess would be that some of these problems are due to the lack of enough numeric precision in the T&L pipeline. Computer math is not precise, for engineering computations the IEEE 64 bit FP format is normally used and it has about 15 places of accuracy. The IEEE 32 bit FP format with about 7 places of precision is typically used in software based graphics processing. The two Quadro's and the GVX1 use on card GPU's with unspecified precision but almost certainly less that the IEEE 32 bit floating point format. The VX1 uses the Intel Pentium III SSE instructions which according to Intel sacrifices precision for speed:
"We decided to offer two modes of FP arithmetic: IEEE compliance for applications that need exact single-precision computation and a Flush-To-Zero (FTZ) mode for real-time applications. Full IEEE support ensures greater future applicability of the extensions for applications that require full precision and portability, while FTZ mode along with fast hardware support for masked exceptions enables high-performance execution. FTZ mode returns a zero result in an underflow situation during computation if the exceptions are masked. Most real-time 3D applications would use the FTZ mode since they are not sensitive to a slight loss in precision, especially if they can get faster execution by using the FTZ mode."
"A basic building block operation in geometry involves computing divisions and square roots. For instance, transformation often involves dividing each x, y, z coordinate by the W perspective coordinate. Similarly, specular lighting contains a power function, which is often emulated using an approximation function that requires a division. Also, normalization is another common geometry operation, which requires the computation of 1/square-root. In order to optimize these cases, the new extensions introduce two approximation instructions: RCP and RSQRT. These instructions are implemented via hardware lookup tables and are inherently less precise (12 bits of mantissa) than the full IEEE-compliant DIV and SQRT (24 bits of mantissa). However, these instructions have the advantage of being much faster than the full precision versions."
The marketplace currently
rewards those vendors that get the high frame rates ( on Quake, Pro/E, etc.
) and does
not put much premium on rendering quality; until that fact changes, it is
doubtful if the quality of the rendering will improve.
Analysis/Conclusion
The Quadro DDR, Quadro SDR and GeForce GPU’s are remarkable achievements due to NVIDIA’s ability to put a very powerful T&L engine into a single chip graphics processor. The performance of the Quadro and GeForce units are very similar except that the wireframe feature is not enabled or implemented effectively in the GeForce GPU.
From the test data some reasonable conclusions about the Quadro DDR card can be inferred:
Polygon Rate - The polygon performance of the Quadro DDR, GLoria II Quadro SDR and GeForce SDR cards are about the same. The GLperf test results, the Indy3D MCAD150, the OCUS R20 and SPECapc Pro/E results support this conclusion.
Fill Rate - The fill rate performance of the Quadro DDR is better than the Quadro SDR or the GeForce SDR. This can be seen in the GLperf test, and the Indy3D Simulation test.
AA Lines - The Quadro DDR like the SDR version does not have any problems with AA lines unlike the GeForce. The GeForce has problems with AA lines and when used with the NVIDIA 3.65 driver it could not run to completion the SPECapc Pro/E Rel. 20 test or all of the ProCDRS-02 tests.
Visualization Apps - For the visualization class of tasks that require a high fill rates, the Quadro DDR is somewhat faster than the GLoria II Quadro SDR and the GeForce SDR which offer similar performance. The test results from the Indy3D Simulation and Viewperf’s Awadvs-03 tests support this view.
MCAD Apps - On the MCAD types of application and tasks, the Quadro DDR is not much faster than GLoria II Quadro SDR. On the large model in the SPECapc Pro/E 20 test suite the Quadro DDR did not show much performance advantages over the Quadro SDR.
CPU Utilization - The Quadro DDR like the GLoria II Quadro SDR does make considerable use of the host CPU as was illustrated by the test results; the up side to this is that its performance will scale as the CPU speed. Thus it will run even faster on the new generation of fast CPU’s just coming to market. Conversely, it might not be too good a choice to use with an older generation slower CPU. This is a very interesting conclusion because you would think that the overhead placed on the CPU would have been offloaded almost completely onto the hardware T&L engine of the Quadro.
Large Textures - The Quadro cards because of the additional 32 MB of on card memory handle large textures sizes in the range of 16 MB to 48 MB better than the 32 MB GeForce cards. This may or may not be an important factor; it depends on the specific visualization task or job.
Now let us compare the relative performance of Quadro DDR, Quadro SDR to the much cheaper Geforce 256 SDR on the more involved tests, all with the same 3.65 driver. The performance results in the table are normalized to the GeForce SDR score. ( A score of 1.20 means that it is 20% faster than the GeForce SDR.)
|
Test |
Quadro DDR |
Quadro SDR |
GeForce SDR |
| Indy 3D MCAD 150 | 1.31 | 1.23 | 1.0 |
| Indy 3D Simulation | 1.65 | 1.02 | 1.0 |
| ProCDRS-02 3+4 sum | 1.11 | 1.006 | 1.0 |
| AWadv-03 | 1.20 | 1.09 | 1.0 |
| DRV-06 | 1.05 | 1.01 | 1.0 |
| DX-05 | 1.01 | 0.99 | 1.0 |
| Lightscape - 03 | 1.01 | 0.97 | 1.0 |
| OCUS R20 Graphics | 1.07 | 1.006 | 1.0 |
Not much difference in performance given the price differential! The Quadro DDR is an excellent pro class card, but will it be worth the added cost over the normal Quadro SDR or the much cheaper GeForce? In most cases no. If AA lines don't matter to you or you don't use larger textures ( over 16 MB ), then the much cheaper GeForce SDR cards are much more cost effective than either of the two Quadro configurations. With that said, the Quadro DDR when it reaches production will be one of the best professional graphics cards available.


